

New Site
February 20, 2021
Topics: Site News
Over the last few months, the front-end of the site has been almost completely rewritten. The code base was getting too big to manage in just regular Javascript, so now it has been migrated into a full fledged React application. This should make things easier to maintain going forward, as well as allow easier integration of new features. There are some more things to tweak, but I think it's pretty much back at parity with the old site.
I've also moved the hosting from a Google cloud storage bucket, over to Google Firebase hosting. There should be no noticable change on the user end, except for the site protocol going from "http" to "https".
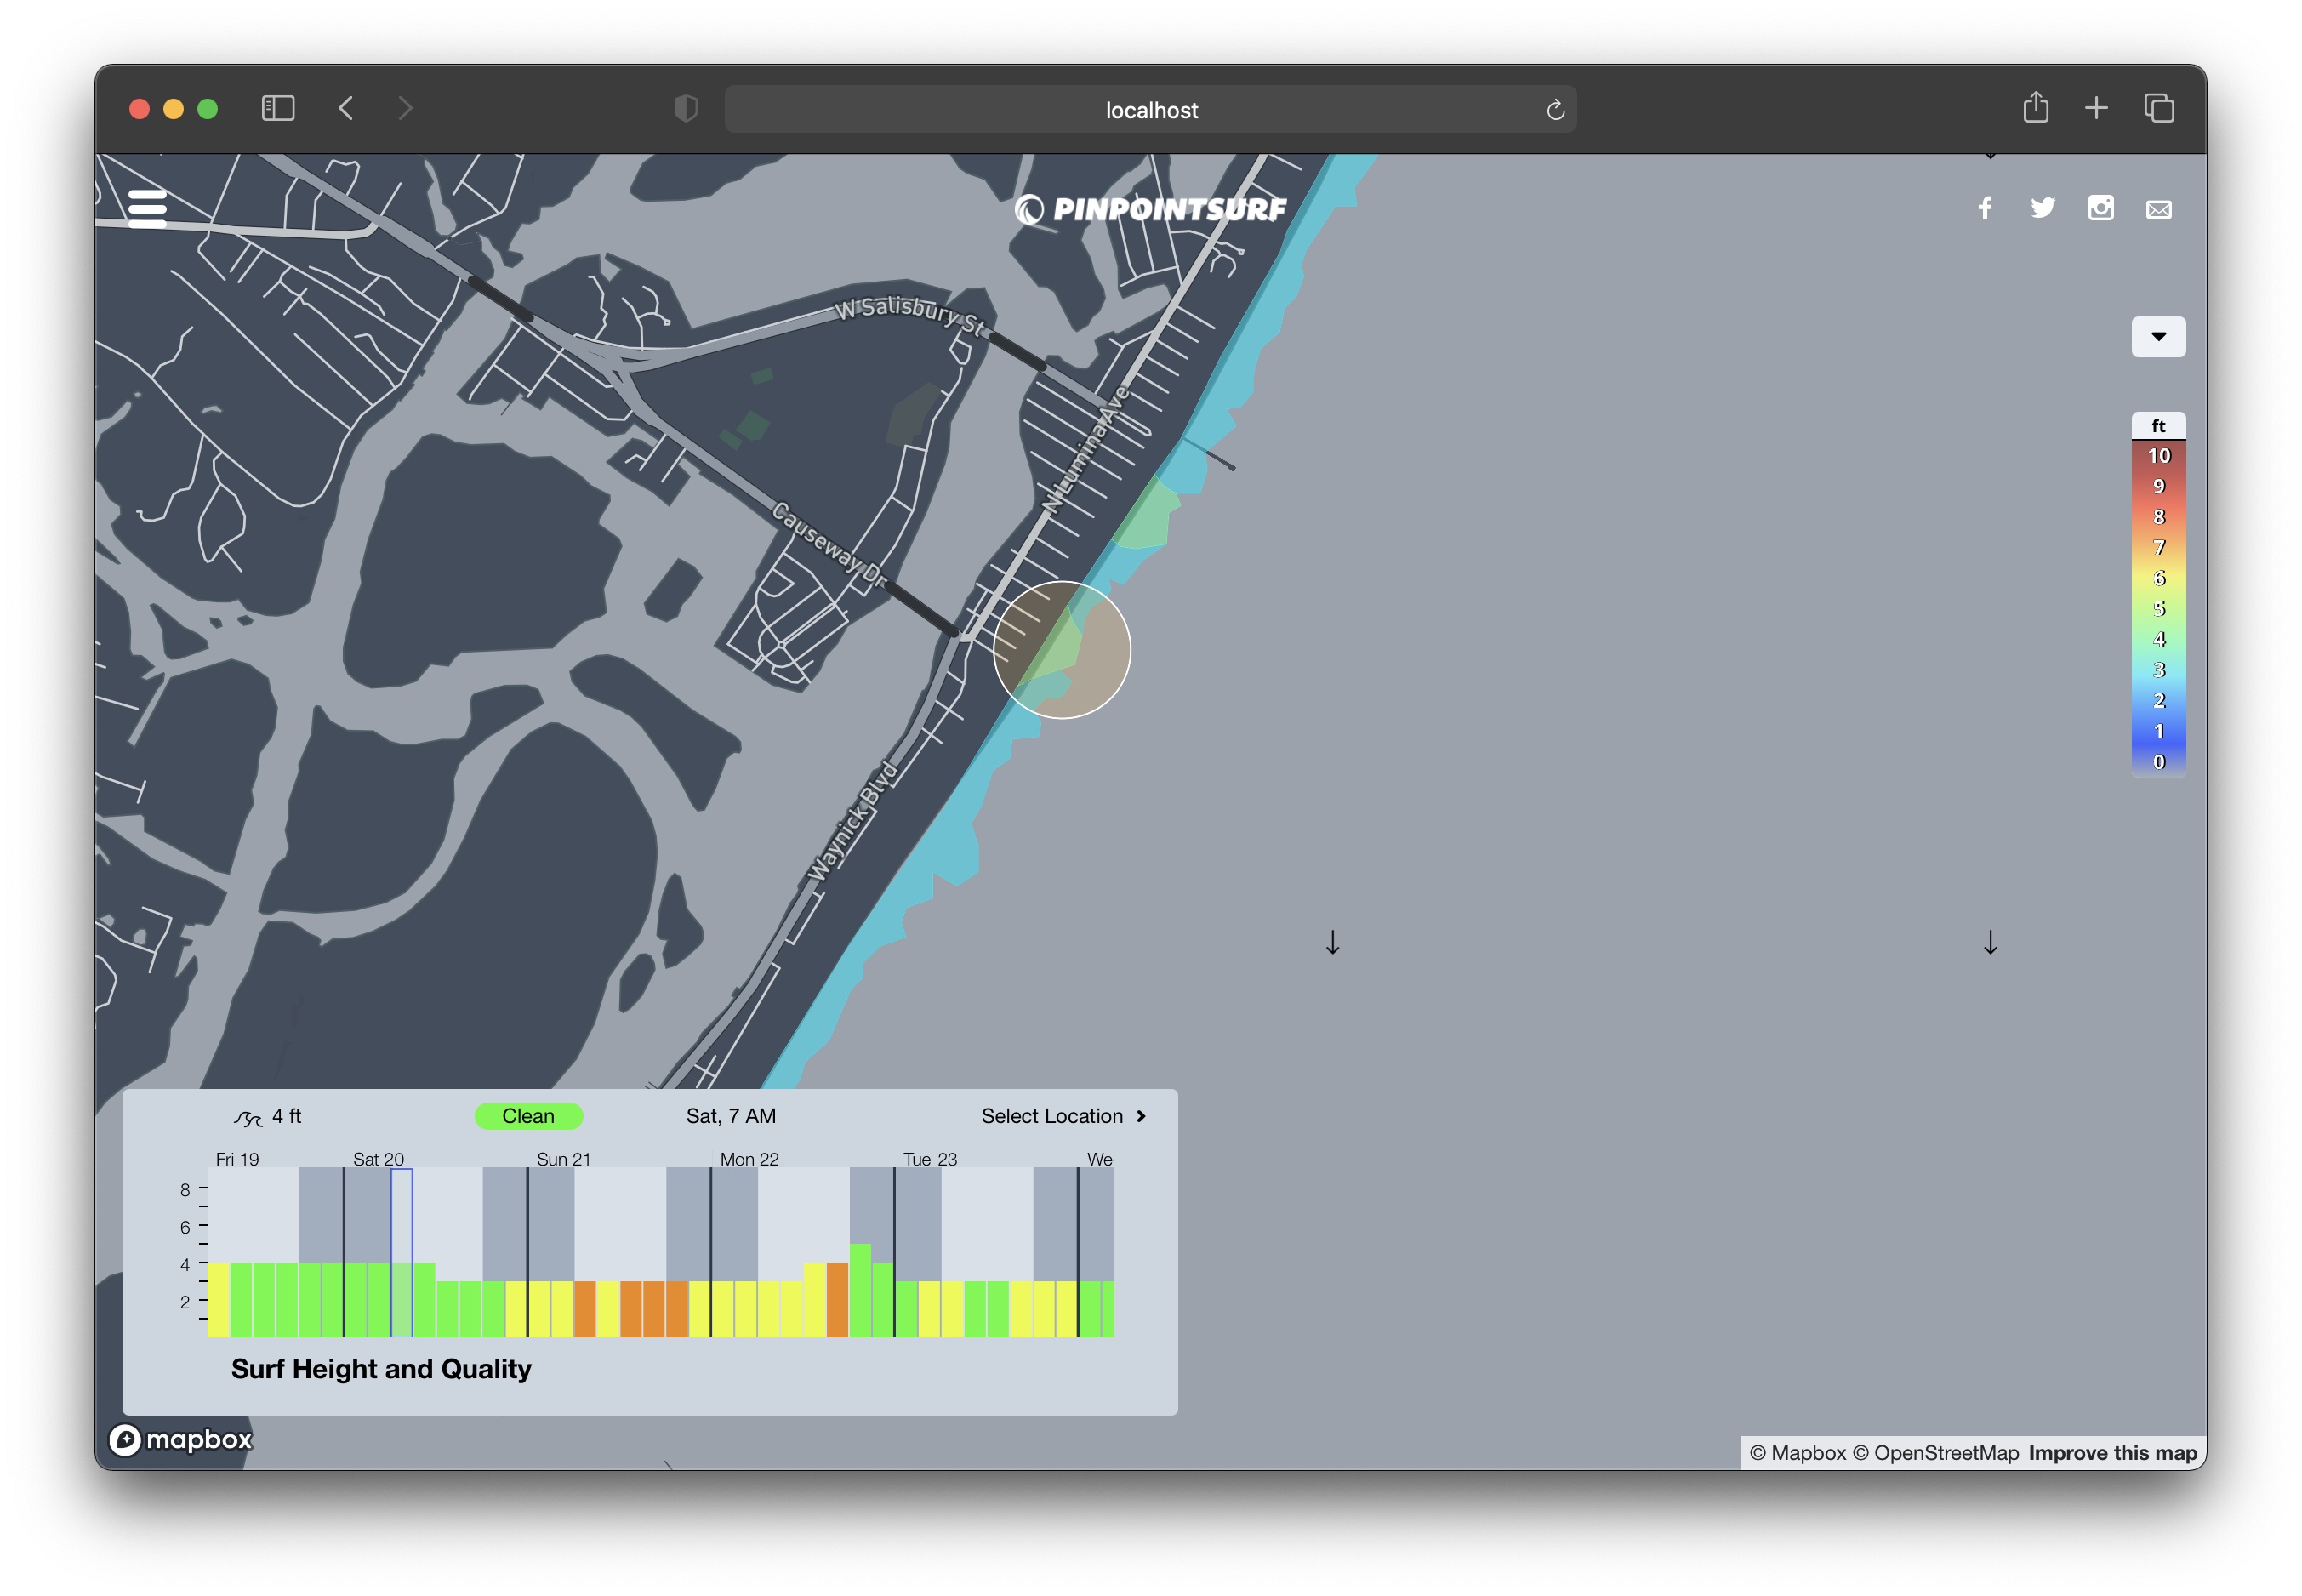
The biggest immediate change, is that the graph is now interactive and is used to control the map. Rather than having to move a time slider or click a forward/back arrow button, now you can simply click the chart to display the desired time on the map. The highlighted bar can also be dragged both with a mouse or finger on a mobile, similar to the old slider. Hopefully this captures the best of both worlds while maximizing screen space for phones.
New Interactive Chart
If you notice any issues, please let me know via social or email. I've tested Chrome, Safari, Firefox on both mobile and desktop. Microsft Edge also works well. Internet Explorer support is 100% dead now as It's too much work to support it going forward.
I'm going to shift into new feature mode now. Expect more layers and charts, plus tide data in the future. The goal is to make this the only site you need to stay on top of your favorite spots.
-Eric