

Increased Height Resolution
July 18, 2022
Topics: Site News
The surf in Southeastern NC has been pretty small, which is typical for June and July. We don't get the large cold fronts or Nor'Easters that drive locally generated waves, and hurricane swells don't typically kick in until August. What that leaves us with are South / Southwest windswells. These windswells don't typically get very big, but many days generate 2-4ft surf along our shores.
I've been fairly happy with the spacial (x, y) resolution of the model, given the many constraints that the site operates within. However, one thing that has been an issue is height resolution and rounding. When the model runs through and calculates the surf heights, I have been rounding to the nearest whole number. That means a 2.50ft wave will show up as the same height on the map and chart as a 3.49ft wave. Since many of the aformentioned summer winds genearte waves in this range, the site has rencently been showing several spots with a 5 day forecast entirely in this 3ft height range. Since many days a 3.49ft wave is preferrable to a 2.50ft wave, I decided to add a few more height break-points to the map. With this latest change, I've added points at .5ft intervals between 0 and 5ft but kept 1ft intervals when greater than 5ft.
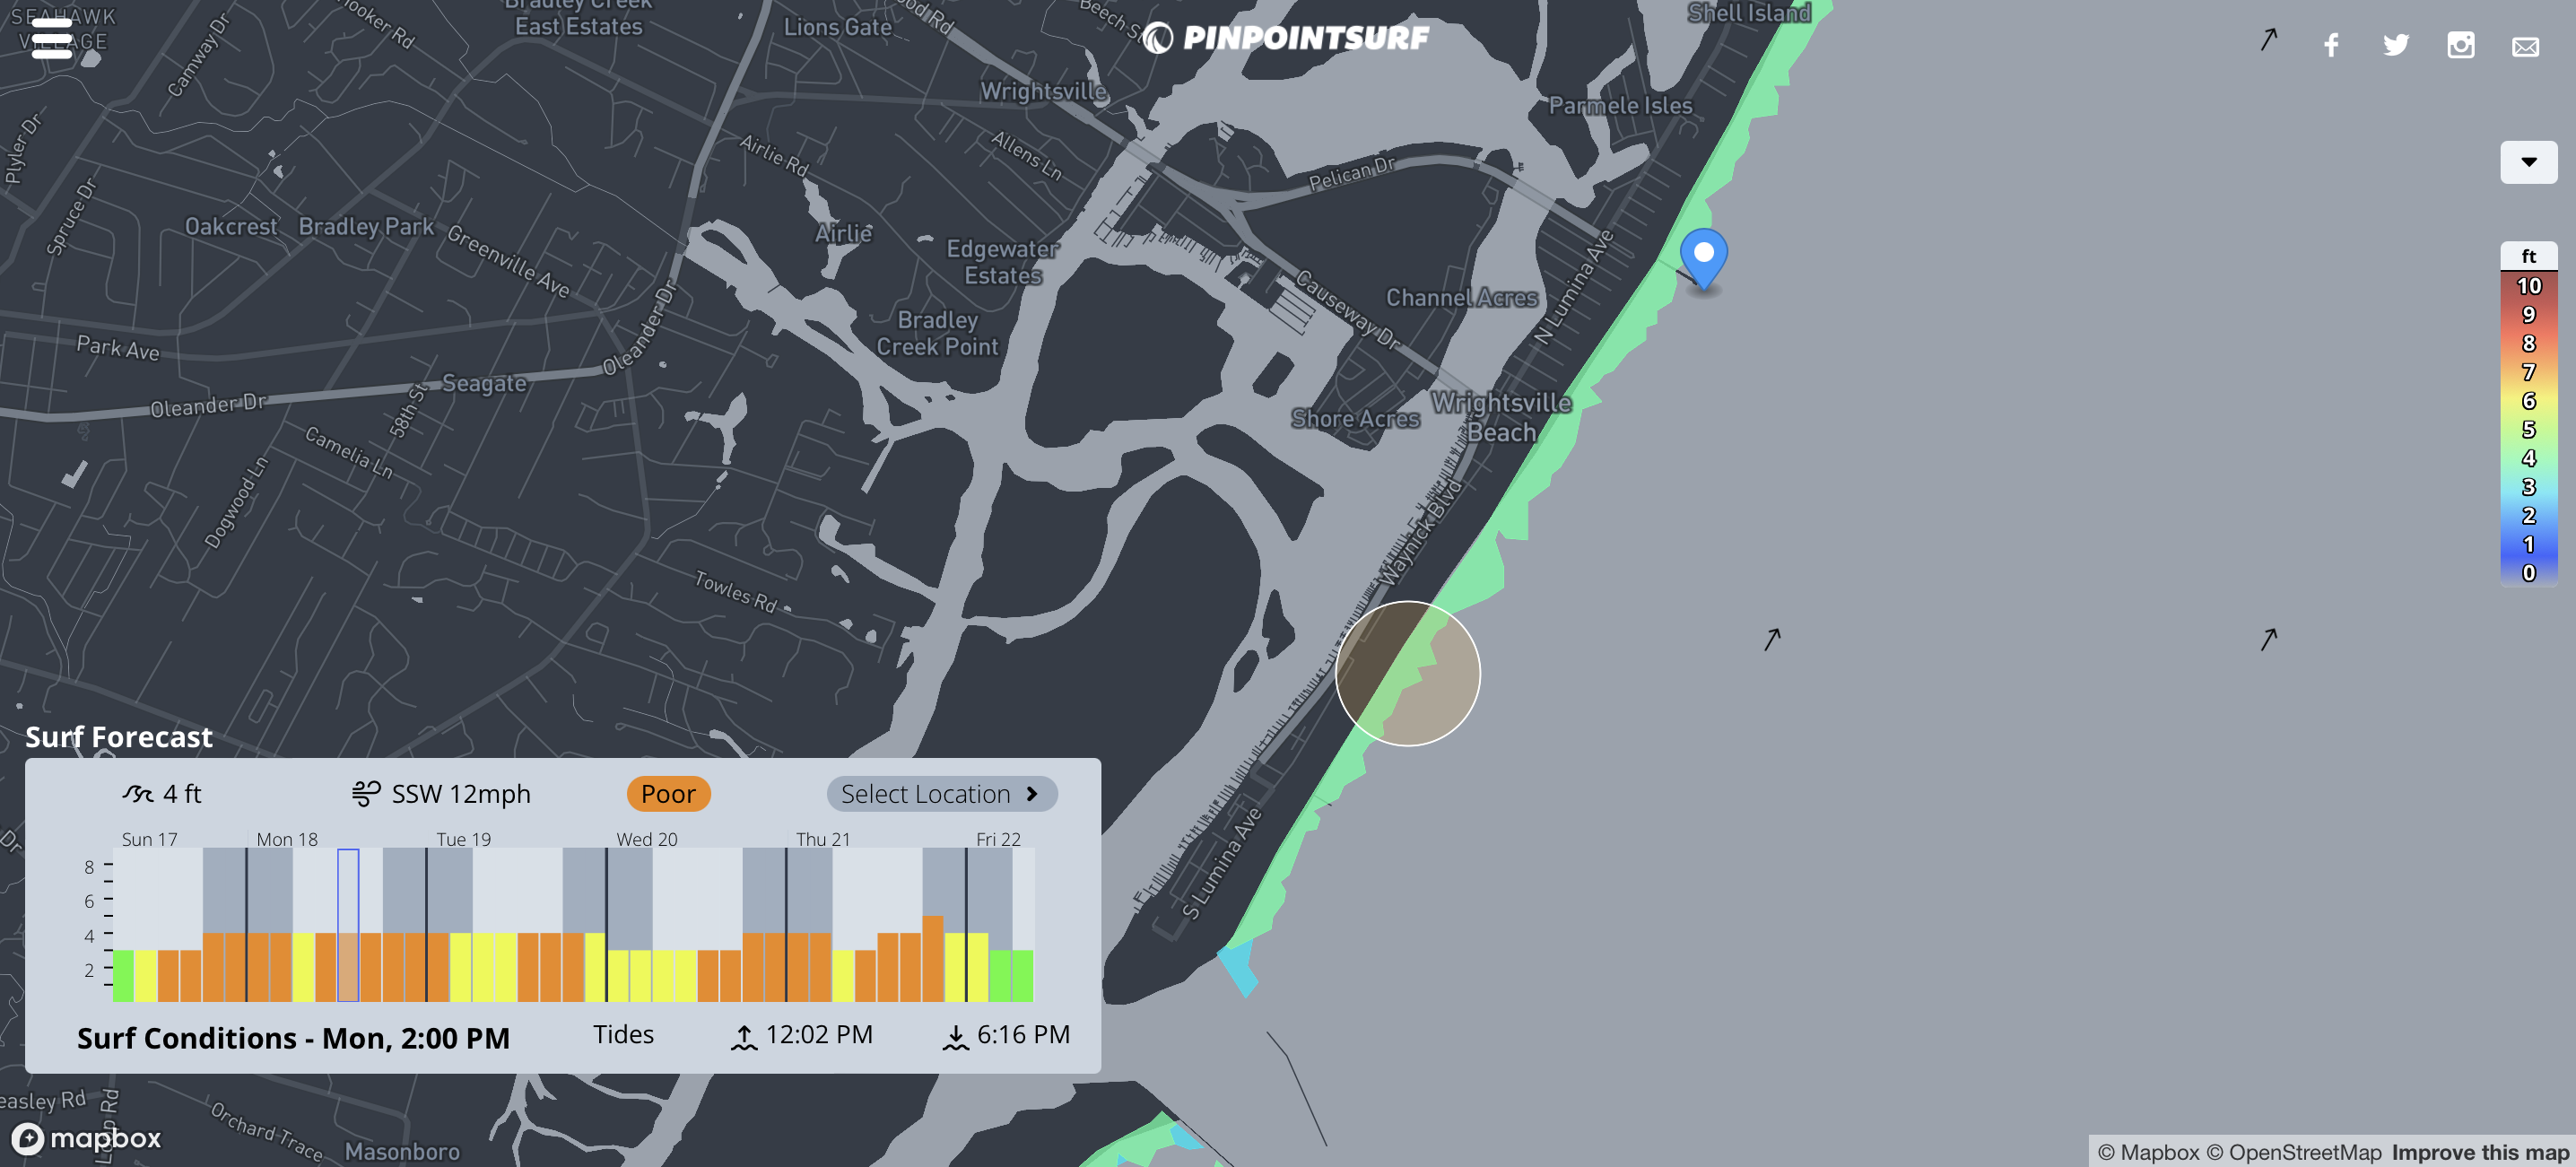
Previous Tiles and Chart
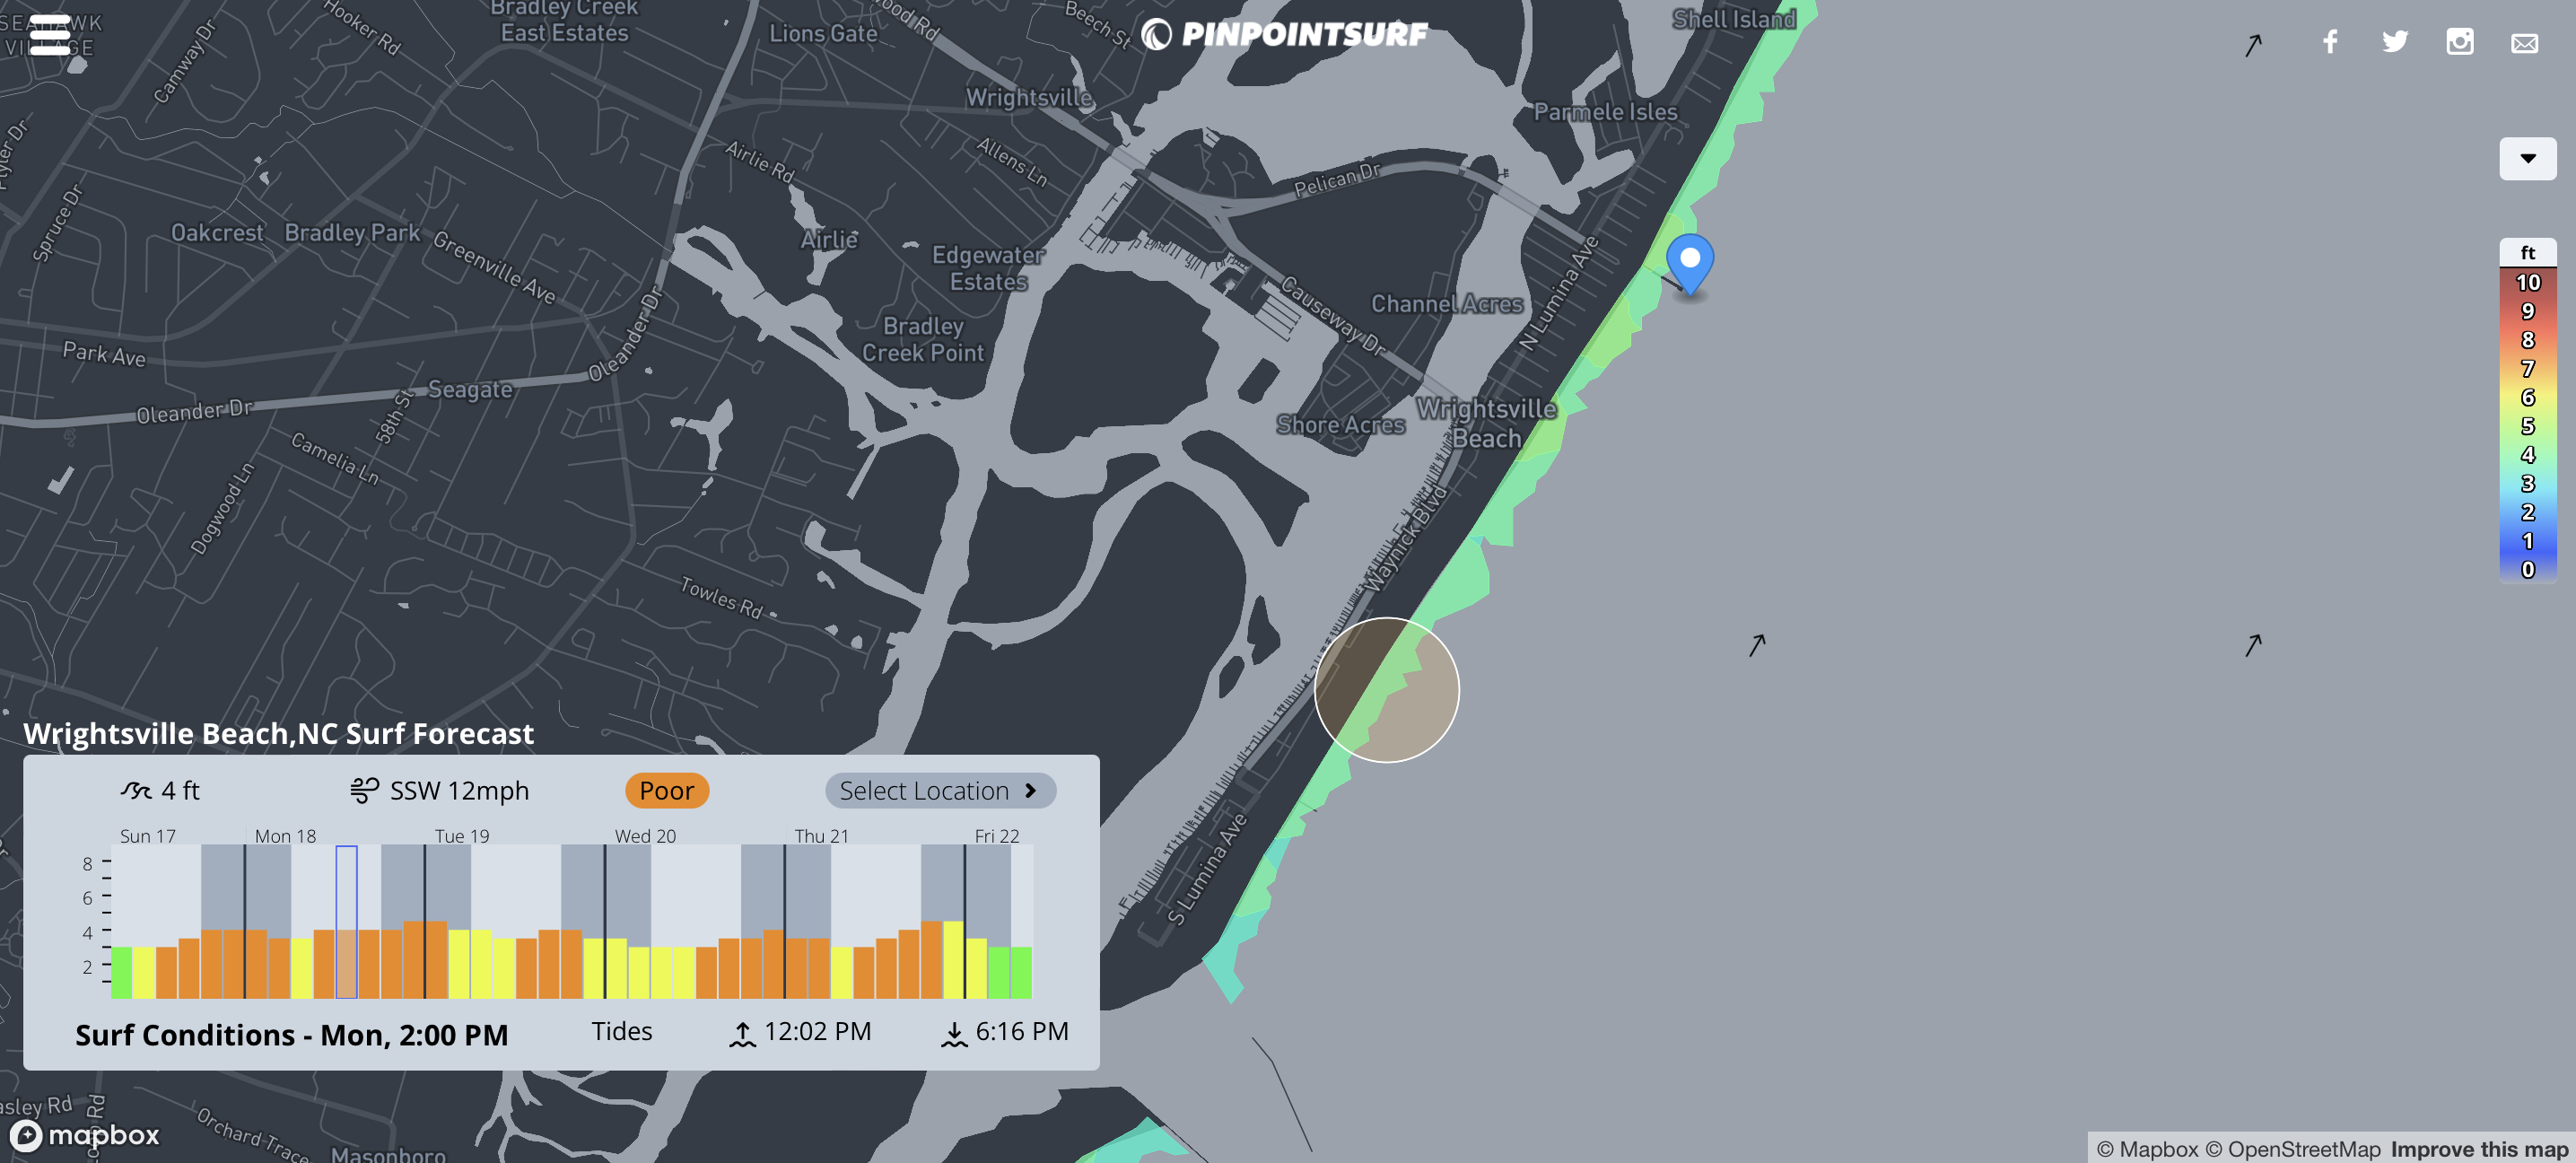
New Tiles (Slightly bigger around C street and Mercer's Pier)
The new colors on .5ft intervals can be a little tough to distinguish, so I bumped up the intensity on the data fill colors a bit. I may need to make some tweaks to the colors in the future, but I think this is a good move in the right direction. Also, the chart heights will represent the new height resolution. As always, any feedback is appreciated!
-Eric
eric@pinpointsurf.com