

Hurricane Henri Swell Analysis
September 3, 2021
Topics: Wave Modeling, Tropics, Buoy Data
Hurricane Henri, Friday
Every time there is a major swell event, I try to look over the data to ensure things are lining up with reality. I surfed that Friday at a spot north of Wrightsville, and late that afternoon at Carolina Beach. While my location and the model were lining up well that morning at around shoulder high, my afternoon session was incredibly fun with some sets pushing 8'. Looking back at the model for that time period, the prediction was in the 5ft range building to 6ft around dark. I would say the model was close, but a little shy of reality. The conditions were much cleaner than forecast as well, but I'll pass that off as the luck of having a huge thunderstorm roll through and kill off the afternoon south wind that was in the forecast.
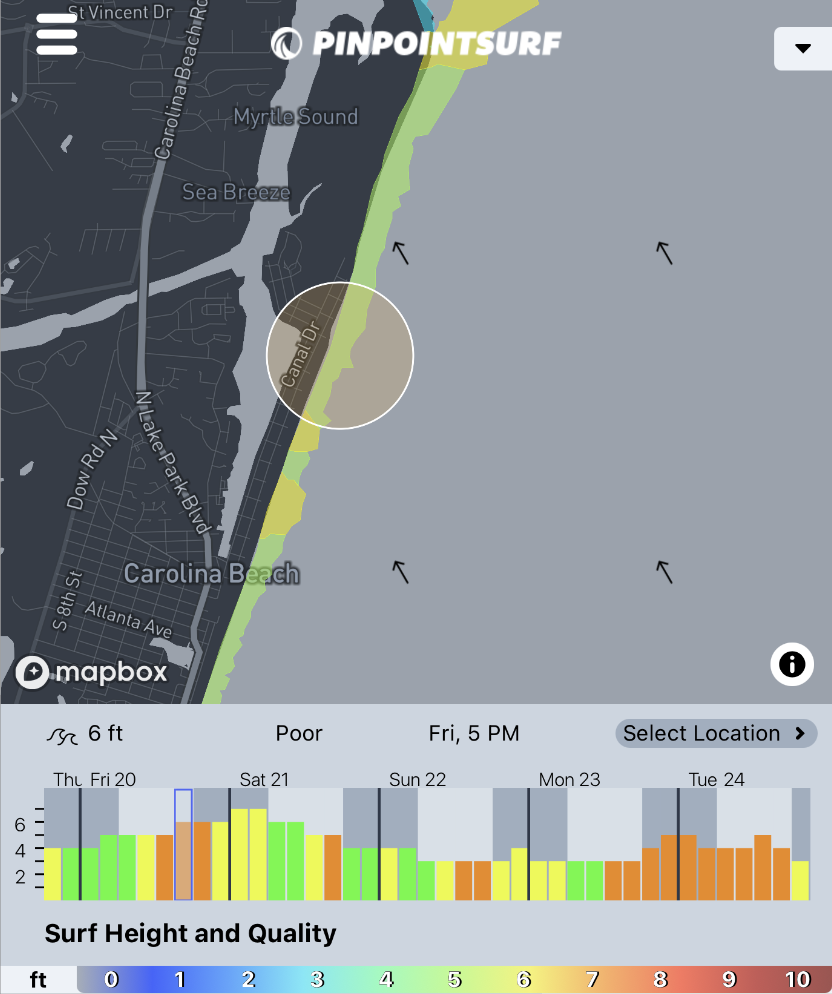
Saturday...
I was ready for more head high waves (or larger) the next morning, but was dissapointed in the size drop overnight. While there was still the occasional 5-6ft wave coming through, the peak of the swell had obviously passed for our area. Time to look back and see where the error was.
The nearshore model running the site works by feeding off the global wave/wind model run by NOAA, called the GFS (Global Forecast System). It's one of the top two generally used, the other being the ECMWF or "Euro". Because the localized models I run don't encompass the whole North Atlantic Ocean, the GFS data is used for incoming swell that is generated outside the model region. Local winds, tides, and bathymetry are all applied to this incoming swell, to model how it interacts as it approaches shore. Below, I've plotted the actual buoy data for 41110 on top of both GFS predictions for that buoy and the poinpointsurf model output for that point. Friday 2pm and 5pm Eastern time are marked with bold bars, as the x axis is in UTC time.
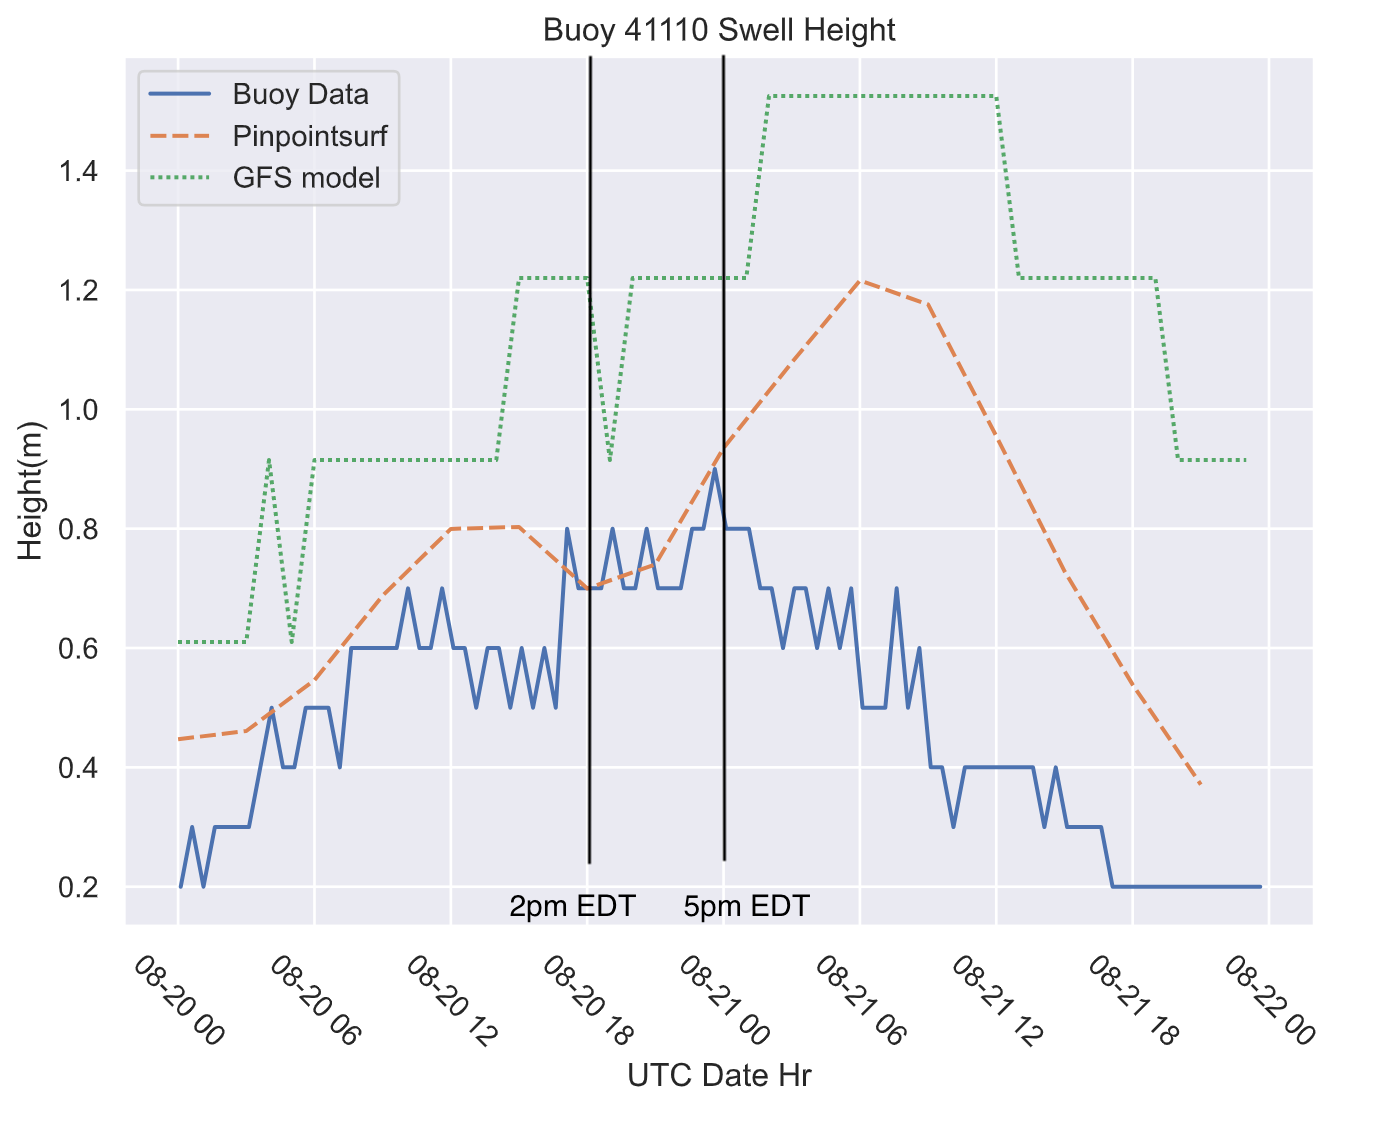
The buoy height and models line up fairly well on Friday. Note the pinpointsurf model is closer to actual conditions than the GFS, as it better handles shallow water errects. Given that the buoy is located off the south end of Wrightsville Beach, it could be slightly off from what I was riding down in Carolina Beach. Saturday, The GFS and pinpointsurf model trend together, but both over estimate the actual conditions at 41110. This is clearly a case where the GFS error was propagating through to the pinpointsurf nearshore model. Bad data in = bad data out.
I also took a look at the wave energy vs period for buoy 41110. The wavelength ,or period of waves affects a multitude of factors as they propagate through shallow water.
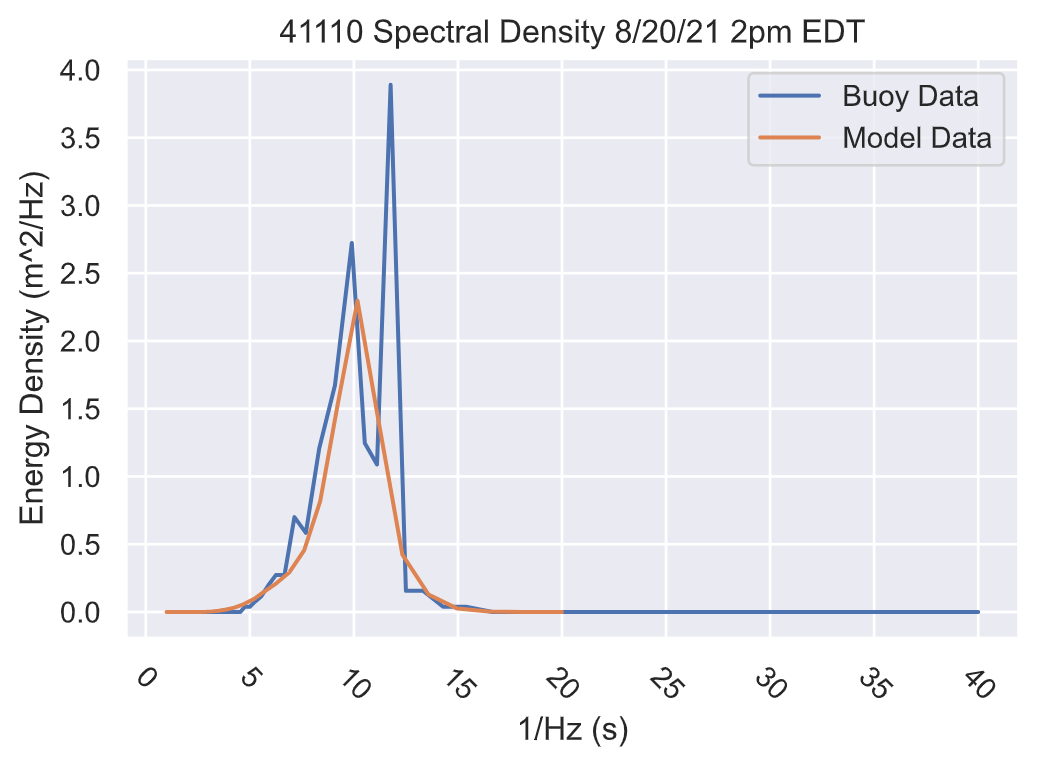
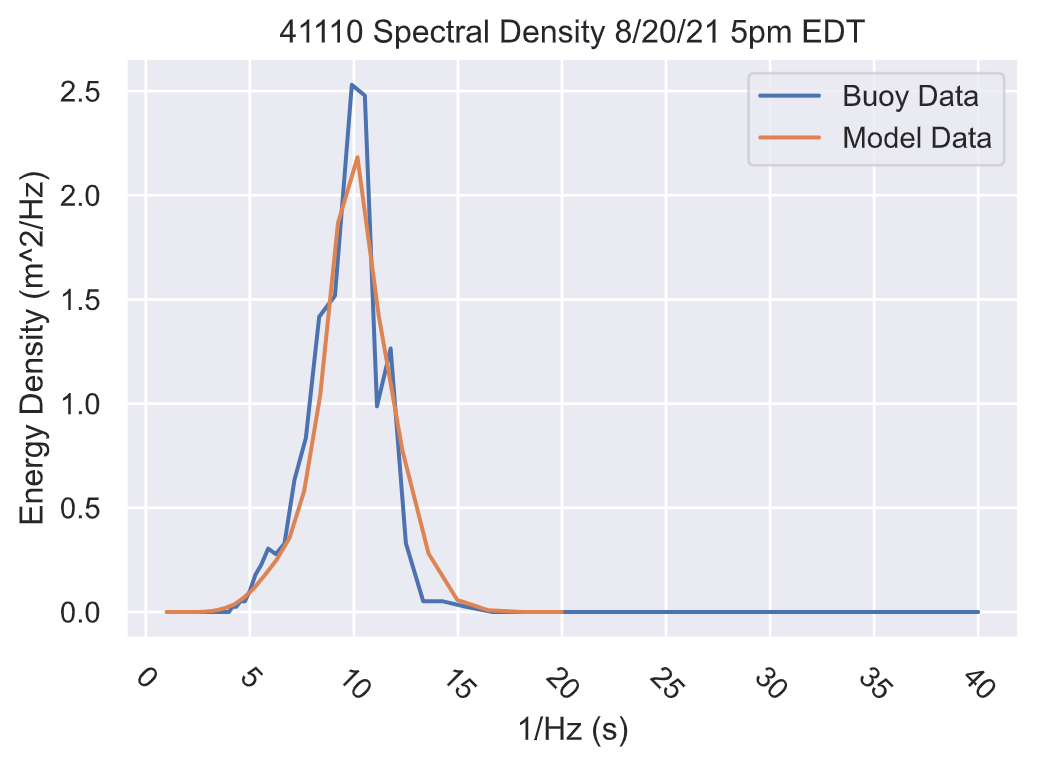
The measured energy density for 41110 lines up with with the pinpointsurf model for the most part, but the second energy peak at ~12 seconds in the 2pm buoy plot is interesting. The wave height is proportional to the area under the curve, which are likely similar given the overall wave height at the buoy. However, a double peak swell may have a constructive interference effect closer to shore that the model can't account for.
Overall, the model performed as well as can be expected given the GFS inputs that never materialized Saturday morning. With Hurricane Larry forecast to become a swell event next week, there should be more long period swell to surf and analyze soon.
-Eric